Air Pollution Index Forecast Model
A TOTAL SOLUTION FOR API FORECASTS
Hong Kong's Situation
In Hong Kong, there are more than 6.8 million people in an area of about 1100 km2, and an additional 20 million population in the surrounding Pearl River Delta area. The rapid growth of industry, the population and the overall economy in H.K. exerted substantial pressure on the environment in this region. The 1998 annual report from the HK Environmental Protection Department (EPD) pointed out the 'continuing poor air quality over Hong Kong', and also suggested that 'Hong Kong and mainland China may affect each other's air quality, but to what extent depends very much on the weather conditions and the type of pollutants involved'. The continuous monitoring and understanding of air quality (AQ) is therefore a subject of interest for both the government and the public.
API
Air Pollution Index (API) is a concise representation of information on air quality. It provides a simple and standard way to report daily air pollution concentrations, based on the measurement of air pollutants like nitrogen dioxide, sulphur dioxide, ozone, carbon monoxide and respirable suspended particulates.
Difficulties in API Forecasts
Compared with the forecasting of weather, the forecasting of air quality is much more difficult. First, prognostic prediction of API is not feasible at this moment, partly because of the lack of good real-time emission data, and partly because of the difficulty in modeling the complex physical, chemical and photochemical processes that occur in our air. On the other hand, purely statistical forecasts of API are often found to be unsatisfactory because they lack the ability to adapt to changes in environmental conditions (e.g., changes in weather pattern and pollutant emission characteristics). Our APIFM makes air pollution forecasting accurate and reliable
Main Concept
In our API Foreast System, the short-range numerical Weather Prediction (NWP) forecast from the Fifth generation PSU/NCAR mesoscale model (MM5) is used to provide quantitative information about changes in weather patterns. This information is used to predict short-term changes in API associated with changing weather events. With the substantial advances in the overall forecast skill of the NWP systems over during the past few years, we realized that incorporation of quantitative NWP forecasts in the prediction of API can improve the overall accuracy of API forecasts. A fuzzy logic algorithm was designed into the system to allow it to adapt and enhance itself with additional data and in changing environments.

Operation
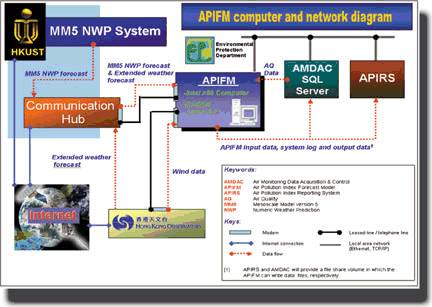
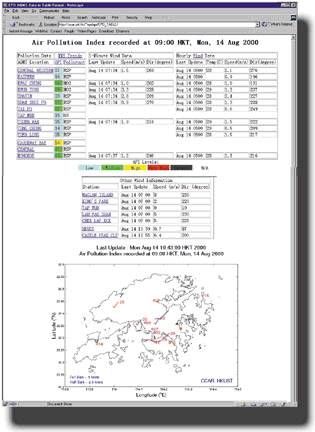
The APIFM system is configured to gather external data through a local area network and a telephone line. The input data includes Air Quality data (i.e., CO, NO2, O3, SO2 and RSP) collected from the Air Quality Monitor stations, real-time meteorological data from the Hong Kong Observatory, and Numerical Weather Forecast Information from HKUST. The output data are saved in HTML format which can be easily viewed and/or printed using standard Web browsers such as Netscape and Internet Explorer.
The system operation is designed to be fully automatic and requires little administrative work. Once the hardware is turned on, the system automatically reads the external data, starts up the model run, archives all input and output data, and cleans up older data at scheduled times. Currently, the APIFM predicts the daily and hourly API, as well as the hourly concentration for each pollutant at each monitoring site.
Features
The system was developed using a modular design with high degree of cohesion and minimum coupling on its subsystems and modules. This allows the system to continue to function if appropriate configuration files are updated after (a) addition or deletion of Air Quality Monitoring Station (AQMS), (b) addition or changes of pollutants measured at the AQMS, and (c) changes of Air Pollution Sub-Index (APSI) intervals and corresponding pollutant concentrations for APSI calculation.
Operating Environment
The system should be run on an Intel x86 based computer with one Ethernet adaptor and two asynchronous communication ports. The operating system on the APIFM computer should be RedHat Linux 5.1.

Success Rate
A successful forecast is defined as one in which the prediction error of API is less than 10 (the range of API observed in Hong Kong is between 20 to 165), the APIFM system was first trained for the prediction of API for 1996 and 1997. An overall success rate of 85% were attained for the prediction of API during the 1996 and 1997 period by the API forecast model. The system was subsequently employed on the 1998 data set (which was not used in the initial training of the model) and it was found that it attained a success rate of 88% for the 1998 prediction.
This results are much better than other statistical prediction systems in place in similar situations. We have found that the inclusion of NWP results from MM5 and the use of the fuzzy logic algorithm were very important for improving the AQ prediction in our API forecast model.
The APIFM system was installed in the HK EPD in March 1999. Up to the end of 1999, the performance of the system has maintained an 85% accuracy rate for both roadside and general stations.


This site is published by the Institute for the Environment, the Hong Kong University of Science and Technology (HKUST - IENV). The information on this site is for education and research purpose only. Commercial or publication use of data must obtain approval from the original information provider and/or HKUST. HKUST - IENV makes no warranty or representation concerning the accuracy, completeness or usefulness of the information contained herein and shall not have any legal liability (including liability for negligence) for any loss, damage, or injury which may result from the supply or use of such information.